

Create a time series card
Create a time series card in the Analytics Explorer by selecting a dataset, configuring metrics, and applying filters to visualize trends effectively
Only users with the Manage Analytics user permissions can organize cards in the Dashboard, create or edit cards or datasets in the Explorer. To learn about how to get the user permissions, see Analytics roles .
To create a time series card:
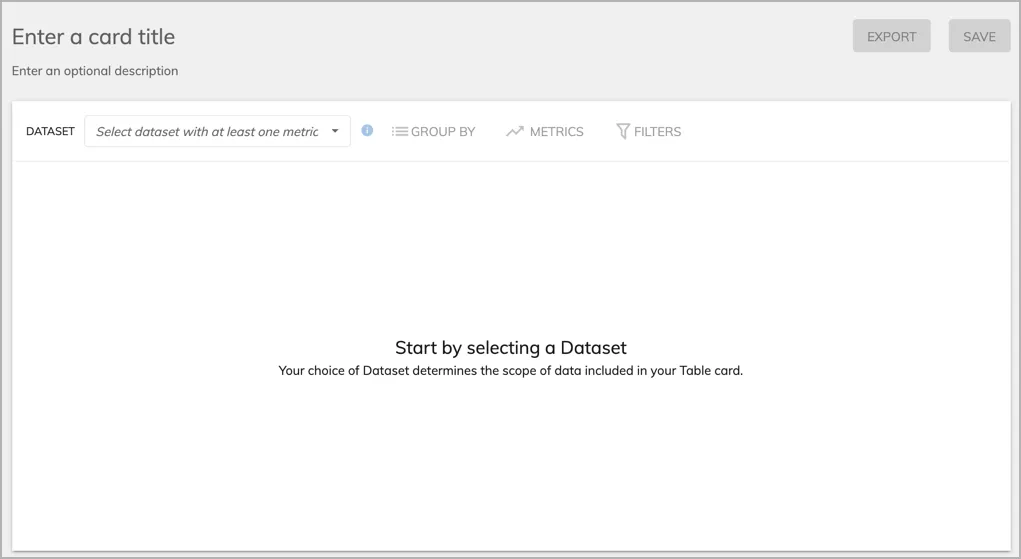
In the name field, specify a name to help people understand the data and the metric available in this card. For example, you can have a card name like “MRR by Product for the past 2 years”.
Select a dataset from the DATASET dropdown list.
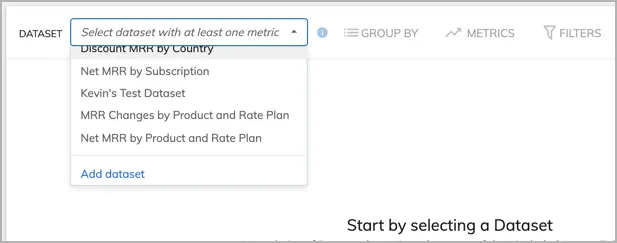
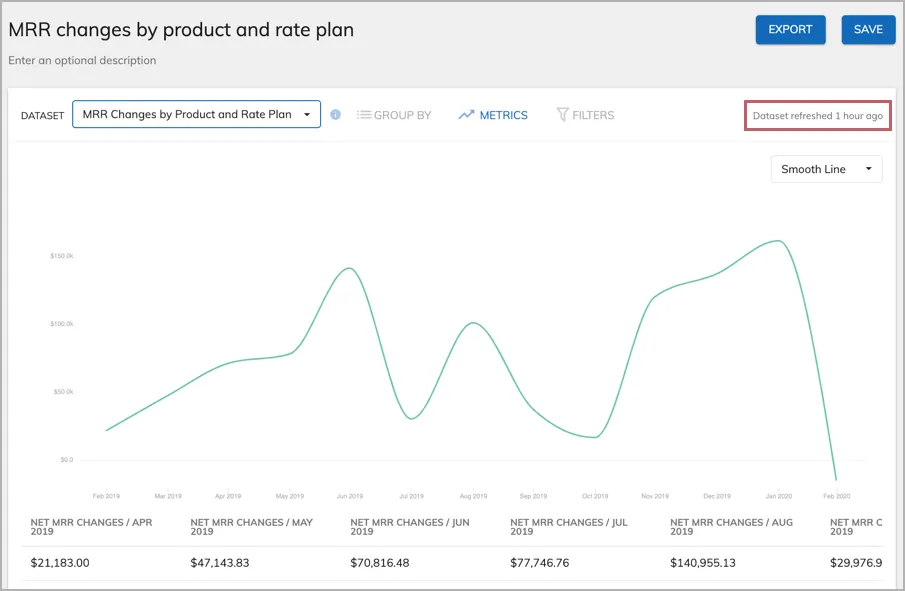
Datasets determine the metrics and fields that are available for use in your card. If the data you want to include in this card is not included in any of the datasets on the list, you need to create a new dataset. If you select Add dataset, you’ll be asked whether you want to be navigated to the page for creating a new dataset. After a dataset is selected, data will be populated in the page. The age of the data (in the format of ‘Dataset refreshed x hour ago’) is shown on the right above the chart. Datasets are refreshed once per day, or immediately after edits are made.
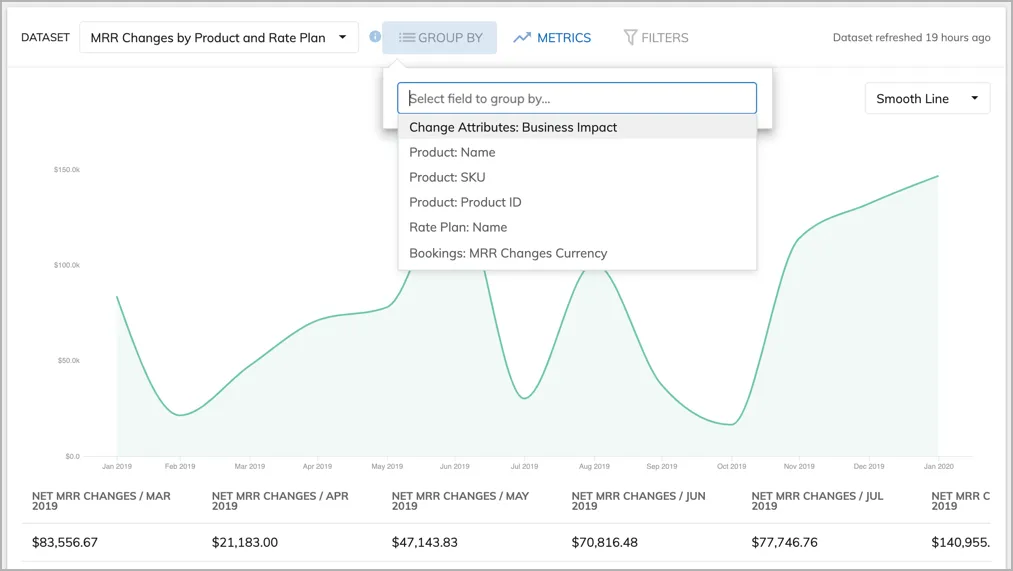
Click GROUP BY and select a field to break down the metric values. This option is especially useful to see trends by products, rate plans, billing settings (like monthly versus annual billing periods), or account-level custom fields that track subscriber segment data (such as geographical region, industry vertical, or sales franchise).
Click Metrics to see the metric charted on the card and the available data range (e.g. last 12 months).
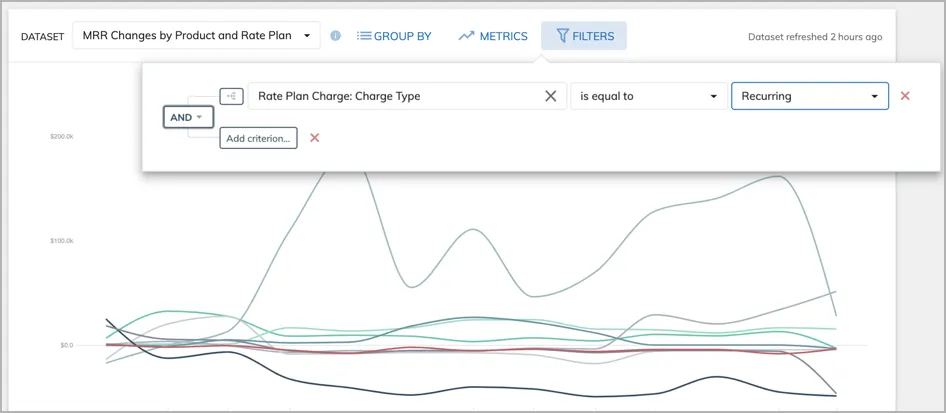
Click Filters to filter data that will be displayed in the card. You can filter data by any field included in the selected dataset.
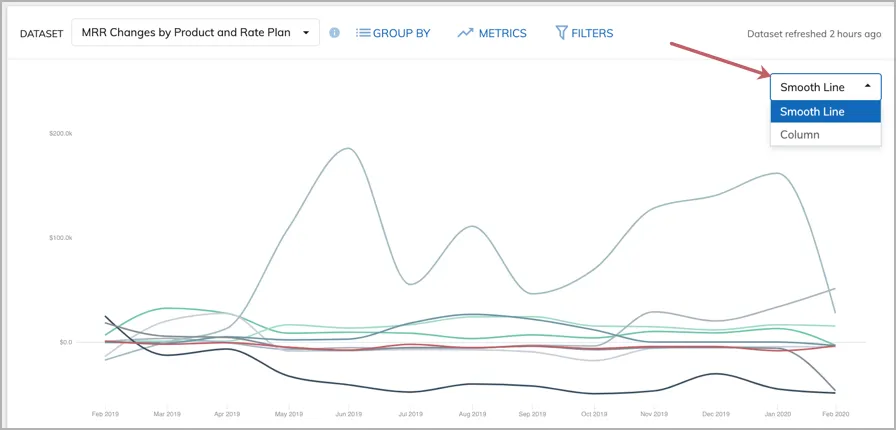
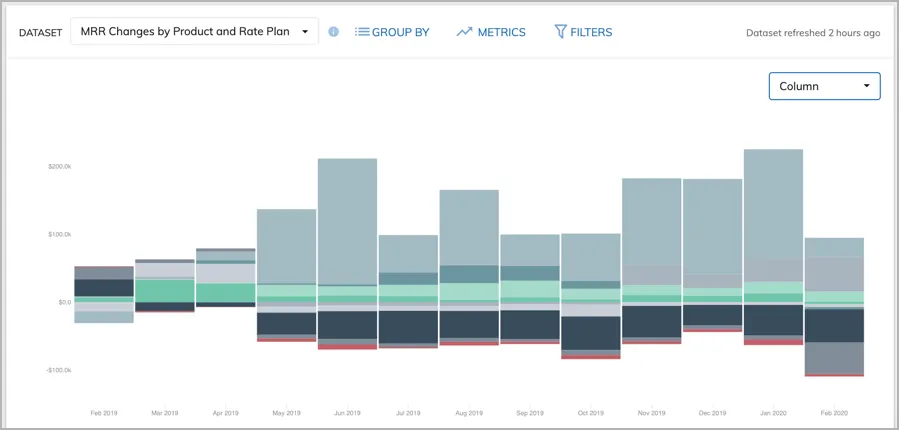
Use the dropdown list on the right to switch chart types between Smooth Line and Bar. Compare the two chart types and select the one that suits your requirements better.
Click Save to save the settings, or click Export to export the data from the card as a CSV for further analysis. The saved settings are immediately visible to all other Analytics users. Please note that only users with the ‘Manage Analytics’ user permissions can save settings in a card. If you need additional user permissions for your Zuora user account, contact the Zuora administrators in your organization.